Row-Z Report xG Model
(Follow @Row-Z Report)
Read anything in football analytics context and you will come across the term Expected Goal (xG or ExpG). The once popular-only-for-the-stat-nerds, xG has finally made its way through to the traditional media. Since the start of this season, it has been frequently mentioned and discussed in TV shows and mainstream channels.
Not that it is not a quick google search away, let me shortly explain the term as follows: xG is a metric which measures the likelihood of a goal opportunity to be scored during a match, depending on many factors such as shot location, distance, type of play that led to the shot, body part etc. Teams’ total xG in a match, then, is a good proxy for understanding what happened in a match: how we would have expected the match to realize and what the scoreline should have been. Similarly, a player’s true performance can also be assessed via this metric, instead of rather limited nominal shot/goal numbers.
It was only natural, then, I dived into it as well and build my first expected goal model. With the aid of Strata data, here goes my first try!
Model Features My initial model uses 25,000+ goal opportunities from three leagues in Europe: English Premier League, Eredivisie and Italy Serie A. For each scoring opportunity, I have created 20+ features which, in the end, were used in a model to assign a probability to each chance – that it ends up behind the net. After excluding penalties, I end up with a sizeable dataset with rich features. Here are some notable factors to mention:
Shot Location As mentioned in my previous posts, I split the football pitch into smaller parts. Location of the shot is probably the most significant factor for a shot’s outcome. Shots from the 6-yard box, for example, have a conversion rate around 40%, while outside the box it is 4%. In total, I split the pitch into 6 (plus the rest) zones.
I actually could (and tried so) split into pitch even smaller areas, but doing so did not improve my model’s prediction power. For the sake of simplicity, I went ahead with 6 zones in the final model. In football analytics context, blue and orange areas in the below pics are sometimes called the ‘Danger Zone’, as those two have significantly higher conversion rates.

Shot Distance I calculate the Euclidean distance between the shot’s location and goal’s center point. For the time being, I have not created an input for angle of the shot (as discussed in great detail by Caley or 11tegen11). I think the shot zone is a good proxy for that, however I will try to improve the models with the angle input in the future.
Match State Discussed in my previous post, match state is a team’s score-based status at any point during the match. In my model, match state did not turn out to be a significant factor, which wasn’t surprising. In my setting, conversion rates did not differentiate when a team’s trailing or it’s a tie. It is highly likely that there are additional factors that are in place here, which I have yet to account for.
Defensive Pressure / Players Another excellency from Strata. For every goal opportunity, my data has a defensive pressure info, on a scale of 1 to 5, 5 being intense defensive pressure on the player. Similarly, the data also contains the number of defensive players that are in direct line between the shot-taking player and the goal. Pretty cool!

Shot Type (Body Part)
Whether the shot was a footer(left/right) or a header.
Shot Type (Situation) I created a binary flag to account for free-kicks, which on average is less likely to be converted compared to open play situations. This is direct free-kicks only, because I exclude penalties from my model altogether. -- Strata data actually contains even more. There is the Chance Rating, for example, which assigns a success rating to each opportunity. Shot Quality, similarly, is a metric to measure how good the shot was taken. For now, I decided to not use these two because I want my model to be as applicable as possible within different data sets. Although providing excellent insights, these two metrics are rather subjective. In fact, one can argue that chance rating, in itself, is an alternative to expected goal.
Model Using these inputs, I then go on about building my xG model, in order to calculate a goal probability for each goal chance in three leagues since the start of 16-17 season. For the interested, I actually ran three logistic regression models – one for each league –, with a binary target (goal yes/no). I ended up with three different models because doing so yielded better predictive power overall. ROC values for the three models are somewhere between 0.78-0.82, which I am content with.
(UPDATE on 27.11.2017: I have now also calculated the Brier scores for each of the models to estimate their accuracy. Brier scores lie within 0.085 and 0.095 for all of my models - as of this date including top 5 leagues + Eredivisie + Champions league + Europa league)
In fact, when I included the subjective ‘Shot Quality’ input into the model, ROC went up to a spectacular 0.95, which I found a little surprising. Due to lack of time to investigate further (I have a full-time job, you know), I excluded that for now.
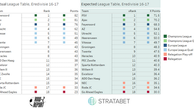
Results I compared my model’s output with the ones spread over the internet, as much as I could. Although it is not possible to benchmark it fully, initial findings are quite promising. Below for example, are top 10 players in (non-penalty - NP) expected goals in EPL last season, according to my xG model.

Eye test passed. Aguero is leading the list with 21 NP xG, followed by Lukaku and Costa. Two players from Spurs, Kane and Alli, secured a spot in the top 10.
Kane not only had a high xG, but also over-performed greatly. While the model expects him to have scored 15.6 times, he actually had 24 goals. That is 50% above expectation. As seen on his shot map, Kane scored 5 goals from outside the box (dark green), three of which were particularly difficult: my model calculates the scoring probability for those three shots around 2.5%. That is to say, we would expect shots from taken that location with particular characteristics to be scored only 1 in 40 tries.

Before we wrap this up, let’s take a look at the top 10 xG in other two leagues:

Jorgensen and Dzeko, scoring leaders from last season are on top of the lists . Dzeko actually was one of the highest producers among Europe last season, second to Cavani from PSG.(1)
Jong from PSV, is placed at the third spot in Eredivisie, although his actual scoring performance was somewhat abysmal. While he was good in creating chances with 15 xG, he couldn’t really convert and had only scored 8 times.
In terms of exceeding expectations, we spot Mertens (Napoli) and Enes Unal (Twente): over-performing by 6 and 4 goals, respectively, compared to what the model suggests.
Expected goal models have a wide range of application areas, from assessing player/team performance to predicting match outcomes to projected league table standings to estimate player valuations. It truly is a powerful tool and I will try to use it to the fullest in my work. In addition, Row-Z Report twitter account will be shining with interesting graphs and tables, using the xG figures. Don't forget to follow!
Until next time!
This article was written with the aid of StrataData, which is property of Stratagem Technologies. StrataData powers the StrataBet Sports Trading Platform, in addition to StrataBet Premium Recommendations.
(1) Source: Understat.
Follow Row-Z Report on Twitter.