League ranking is not a destination but a journey (along match state minutes)
(Before anything else, I have reached 1000 followers on Twitter! Thanks to each and every one of my followers and especially Stratabet for providing me this opportunity).
*
A few months ago, I had written a blog post on match states and how Eredivisie teams performed during different score lines. I had looked at teams’ offensive creation and also the conversion rates. One crucial point missing in that analysis was the amount of minutes a team spent in each state. Clearly, the duration in each match state has a large impact on the nominal numbers. You can’t expect a team to create lots of chances when ahead on the scoreline, for example, if they spend 5 minutes per match leading.
Lately, I have spent some time (a lot, actually!) to code my way around match state minutes and the results, in the end, open up a wider scope for analysis. Let’s see how it goes!
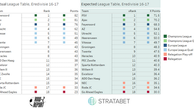
Match state minutes Below graph shows the % of minutes each Eredivisie team have spent during the 17-18 season in different match states. (league table via Whoscored)
At top we see the usual suspects: League leaders PSV, who have won 15 in 18 matches, have spent 55% of total minutes played in leading situations. And only in 9% they were behind on the scoreline.
Ajax seems to have some problem in breaking the tie: 48% of minutes played in draw.
Along with some familiar teams (Sparta, Roda), the other end of the table hosts one surprising team: Den Haag.
They are currently ranked 7th in Eredivisie, with 26 points in 18 games. However, according to above calculations they have been the 3rd-worst team in leading minutes. Den Haag spent 17% of total game play minutes in winning state yet somehow managed to grab 8 wins this season. They seem to score and then defend well when it matters.
Before I move on the next section, I’ll leave the reader with this photo of the beautiful beach in Den Haag (Scheveningen, actually). It certainly helps in these dark and cold days of winter!

Offense in Match States
Back yet? Good. Now let’s take a look how Eredivisie teams fared in offense. Below, I have compiled some numbers for Eredivisie teams for the 17-18 season.
Teams have taken more shots and scored more goals in tie states. This, however, is highly influenced by the minutes played. Since majority of the matches are spent in draw states (starting every match with 0-0 scoreline surely helps), it is only natural to see nominal numbers for tie state to be higher.
To account for this, I have created a new metric – shots per 90 in match state. For that, I divide the total shots (and goals) created in each state to total minutes and then extrapolate to 90. In essence, this metric can be interpreted as the offensive output created as if the whole match was played on that state.
Adjusted for minutes, we see that:
Per a hypothetical 90 minutes in each state, teams take more shots when ahead (13.1) than behind (11.8).
Leading teams score more goals on average than other states with 1.69 goals per 90 minutes.
We also see that there are virtually equal number of shots taken in tie and behind situations (11.7 vs. 11.8) and yet scoring rate is lower when behind – 1.38 p90 (tie) vs. 1.26 p90 (behind).
Defensive presence
Why could this be? In theory, this finding can partly be attributed to the fact that trailing teams go more stronger in attack and leaving their defense weaker. In turn, this would mean higher quality chances left to opposition (hello, expected goals).
On an important side note, it is clear that stronger teams spend more tie in "ahead" situations, which is probably another reason for the higher number of goals - they would have scored regardless of the state. But still, I guess it's also nice to look at defense as well.
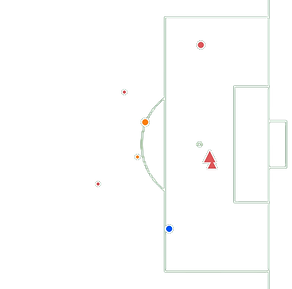
Thanks to excellent data from Stratabet, we have the number of defensive and offensive players present during shot taking. Here is the distribution of shots by the net difference in number of players. "+Defender" means there were more defenders while the shot was taken, and the opposite is true for “+Attacker”.
If the shot-taker team is ahead on the scoreline, there is 32% likelihood (i.e. 1 in every 3 goal chances) that defense is outnumbered. Moreover, 6% of those were a 1v1 (or better) chance against the goalkeeper. For comparison, the same percentage for trailing teams is lower - only 28% (22% + 6%).
Average number of defensive players (during shot taking) also shows a similar pattern. There is almost a third-of-a-player less defense when ahead (2.27 vs. 2.59).
Consequently, I guess it does make some sense that teams ahead in the match are scoring more goals – they face weaker defense to begin with!
Ranking is a journey
What about league table? In the current situation of how sports (or anything) go, the winner is determined by the score at the end of the match (pretty boring, I know).
What would change if points were given based on the minutes spent on match state? What if, we evaluated teams not by where they ended up at the end, but by their “journey” during the game?
To see how the league table would be in this alternative world (much more exciting, I know!), I crunched the numbers to allocate points to teams according to minutes in match states. As of January 11, 2018 Eredivisie teams would be ranked as follows in the 17-18 season.

Who would benefit? Well, not Den Haag apparently.
By the minutes Den Haag spent in match states, they would collect a little short of 18 points from 18 games, putting them in the relegation battle at 16th spot. Heerenveen, on the other hand, could have found themselves in the race for Europa League as they would be 5th in the table.
As per my previous post in expected points, Heerenveen was again one of the largest underperformers last season. Interesting.
Conclusion
In this post, I tried a new approach to evaluate teams, by breaking down to match states. Adjusting for time spent, teams, evidently, perform quite different during a match.
What else can be done? Well, many.
Players, for example: How do players perform in different scorelines? Who scores the most crucial goals – goals that brings point(s)?
Or teams: which teams are able to protect their leads better? I'm looking at you, the fine city of Den Haag.
Until next time!
This article was written with the aid of StrataData, which is property of Stratagem Technologies. StrataData powers the StrataBet Sports Trading Platform, in addition to StrataBet Premium Recommendations.
Follow Row-Z Report on Twitter.