


Expected Saves and De Gea's Deserved Reputation
- Jorj Terzioglu
- Nov 10, 2017
- 6 min read
I have been posting a lot of analyses and graphs on my Twitter account lately. One of the more popular graphs is the defensive efficiency of teams, measured by the difference between expected goals against (xGA) and the actual goals conceded. A defensively over-performing team, as I use the term quite frequently, is the one who have conceded less goals than the xGA numbers suggest. For example, below is such a graph for the Premier League sides, through match week 11 of the 17-18 season.

Red dots are the actual goals conceded whereas the green diamonds show the expectations. One way to interpret this graph is as follows: the larger the difference between those two, the better (or worse) performance.
On the defensive efficiency graph, three teams grab our attention at first sight: Manchester United, Burnley and Swansea (with largest lines in between dots). United is especially interesting as they have conceded 9 goals than expected, with a total of just 5.
What are the underlying factors behind this performance? Measured by the xG, United defense do allow opponent teams to have some chances and with good quality.
Man United is only the fourth best team in xG against with around 14.1
Chelsea have allowed twice the number of goals (10) from essentially the same xG (13.9)
Tottenham have conceded more goals (7) from way less xG (9).
Apparently, something magical (which may or may not include pure luck) happens and scorers fail to convert when they face United. That brings us to main theme of this post: Goalkeeper performance.
GK Performance
How much of this defensive success can be attributed to goalkeepers? After all, it might be the case that the opponents were simply horrible and put all their shots into Row-Z (I’ve been waiting to use this term for 3 months now!) . Or, more likely, defense was good enough to deflect the shot even before it ended up at the GK.

Measuring GK performance, then, becomes a little (not much!) tricky task. We need to attribute success to GK’s when it’s relevant. And that’s what I try to do with my ‘Expected Saves’ model.
Expected Saves (xS)
For the above mentioned reasons, using the traditional xG model and simply using that number as expected saves is not the ideal way to go.
Where GK’s really make impact is naturally the shots on target. For this, I needed to reduce my dataset to shots on target only and run my models accordingly. Luckily, excellent data that I have access to thanks to the fine gentlemen at Stratagem allows me to make such distinction: data set for my xS model only consists of shots that are either goals or saved by the goalkeeper, i.e. shots on target.
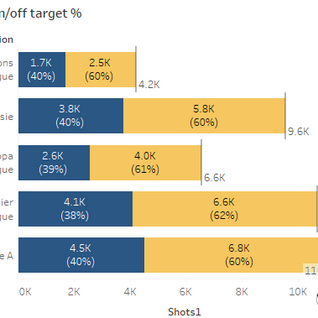
In my data with over 40,000+ shots from five competitions, roughly 40% is on target. Moreover, quite logically, conversion rate (goals divided by shots) in this particular set is quite high (around 33%).
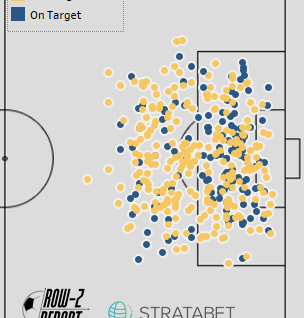
Here are all the shots of a Premier League side since the start of last season. Can you guess which
team?


Model Methodology
Since it’s basically the same procedure and set of inputs as in my original xG model, let me skip the details for the expected saves model at this time. For the interested, here is a link to a previous post where I explain my methodology.
Results
Since the xS model has a smaller scope with shots on target only, it regresses to a much higher average (33%, compared to 13% in all shots). That is why (I think) the results aren’t directly comparable to original xG numbers. What I will do instead, is to look at the smaller dataset in itself and compare expectations with actuals. If a GK has saved more than his xS numbers suggest (again, based on shots on target only), then I’d conclude the GK to be overperforming.
To avoid confusion regarding the new (artificially higher) xG numbers, I choose to create a GK performance index. This metric basically normalizes GK performance such that 1 is average performance and above 1 is better.
Without further explanation a-do, here is the ranked list of Premier League goalkeepers this season, according to this metric.

De Gea has a well-deserved reputation! At the top of the list we spot Manchester United with the GK index of 1.55. This essentially means that De Gea, from the shots he faced (i.e. on target), conceded 55% less goals than expected. Or we could also interpret that he saved 55% more than what we would expect from an ‘average’ keeper.
Moving along the list, we actually see some interesting results.
Burnley's Pope and Heaton, and Swansea's Fabianski have been doing pretty well so far this season. A very recent article at BBC Sports mentioned the very same names as best keepers - I guess I am on right track!
At the other extreme, West Bromwich keeper has been causing some trouble: metric at 0.66, he basically allowed one-third goals more than he ‘should have’.
Liverpool’s Mignolet is tied at bottom fourth, underperforming around 20%. This is one of the factors behind Liverpool’s defensive struggles this year. They are the sixth worst team in total goals conceded – not a bright picture for a title contender for sure.
In the middle, we see two of the big-6 – Chelsea and City – with around average performances from their GK’s.

City’s situation is particularly interesting because Claudio Bravo, keeper from last season, was heavily criticized. Guardiola went on and transferred Ederson from Benfica for a record fee of £33m this summer. Guardiola’s plan seems to have worked so far this season. I guess City doesn’t really need a superb keeper - an ‘average’ keeper is just enough.
An unusual graph
When doing stats on football, it’s quite difficult to see good teams not packed together. Actually, to observe that ‘good’ teams perform similarly serves as a validation of one’s own analysis. Be it shots, goals, xG, points, goal differential or whatever, we usually observe top-class teams close to each other on a graph (or a table), and quite separated from the rest of the pack. In the end, good teams shoot and score more which leads to more points and goal differentials. This is what brings wins, titles and cups anyway.
That is why I find the following graph quite interesting. It depicts the GK performance and the average shot quality that teams allow. For shot quality, I use the same xG figures from shots on target only. When combined with GK index, we see some unexpected neighbors in the four quadrants.
On the bottom right, we see that Liverpool and Arsenal are allowing high quality shots with below average GK performance. They have some unexpected peers in this group including Everton, Stoke and Crystal Palace. Interesting!
Thanks to De Gea, United is at the highest while conceding shots with league average quality.
Top GK’s show at the top part of the graph with teams including, Burnley, Swansea, Newcastle. Considering Swansea’s current ranking of 19, I wonder where they would be if their GK weren’t this good so far.
City’s closest peer is Huddersfield – both teams have performed average on both metrics
Chelsea and Tottenham are on the better side of the scale with allowing the least dangerous shots on average (leftmost on graph).
Sustainability
Above numbers are from the 17-18 season only and thus from a rather small sample of 11 matches. A bad performance in one match (say Utrecht’s loss against PSV) could distort the results in the wrong direction.
It’s been long discussed in Football analytics that real player talent/performance lies on repeatability. A player who is able to overperform expectations consistently over years, or only even in consecutive seasons, could indicate premium skills. Sadly, works on this area have shown that such players seldom exist (if ever).
With this idea in mind, I went on and looked at GK performances since last season. A season and a half approximates to around a maximum of 50 matches per player, which is still not a large enough sample. Yet, I guess it’s still worth a look and another post!
Until next time!
This article was written with the aid of StrataData, which is property of Stratagem Technologies. StrataData powers the StrataBet Sports Trading Platform, in addition to StrataBet Premium Recommendations.
Follow us on Twitter.


コメント